This chapter contains the following topic:
Selecting ABC Analysis Reports
The ABC Analysis selection enables you to print year-to-date item analysis.
This analysis report shows the dollar value of sales volume, year-to-date cost of the items sold, and year-to-date gross margin (sales minus costs) for each item.
This report separates items into three value classes by percentage:
| • | The top percentage (code A) of inventory value, |
| • | The middle percentage (code B) of inventory value, |
| • | The bottom percentage (code C) of inventory value. |
The separation may be based on sales, cost, or margin.
The boundaries between these categories are flexible. You define them each time you print the report.
The ABC codes are based on percentages. In a typical business, a large percentage of total sales is based on a small percentage of items that are carried in inventory.
For example, it would not be unusual for 20% of your inventory items to account for 80% of your sales volume. These are your A items.
Continuing with this example, you might find that another 20% of your inventory items accounted for 15% of your sales volume. These are your B items.
Finally, you might find that the remaining 60% of your inventory items account for 5% of your sales volume. These are your C items.
A items are much more important to your business than B or C items. So you would want to keep tighter control over A items than over C items.
A items are typically high-priced items that sell in moderate volume, or moderately priced items that sell in high volume.
C items are typically high or medium priced items that hardly sell, or low priced items that sell in moderate to low quantity.
B items are in between. They provide the transition between A items and C items.
The ABC code is an attribute of the item, and may be individually maintained by the Items selection. However, the code on file is not used in creating this report. Rather, this selection regenerates the ABC code of each item whenever you print the report, without reference to the existing codes. You then have the option of propagating the new codes to the items, and thus over-laying the existing.
Select
ABC analysis from the Reports menu.
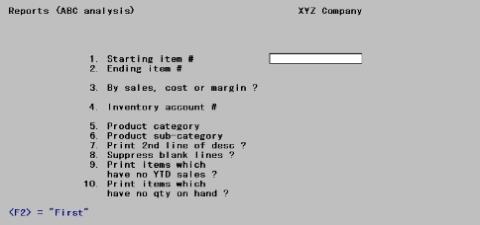
The following screen displays:
Enter the information as follows:
1. Starting item # and
2. Ending item #
Enter the range of item numbers to include on the report. Follow the screen instructions.
|
Example |
Press <F2> for First and Last at each field. |
3. By sales, cost or margin ?
Enter S, C, or M to analyze based on sales, cost, or margin.
If you enter S, code A will be those items with the highest year-to-date sales volume in dollars, code B will be those items in the middle range, and code C will be those in the lowest range.
If you enter C, the three codes (A, B and C) will be based on the total year-to-date cost of the items sold, in dollars.
If you enter M, the three codes (A, B and C) will be based on the year-to-date gross margin in dollars for each item (gross margin = sales minus cost).
|
Format |
One letter from the table above |
|
Example |
Type: S and then press <Enter>. |
4. Inventory account #
Options
Enter the inventory account for which to print the report, or use one of the options:
|
<F1> |
For the next inventory account |
|
<SF1> |
For the previous inventory account |
|
<F2> |
For the Merchandise Inventory account |
|
<F5> |
For All inventory accounts. Items will be grouped by inventory account. |
|
Format |
Your standard format for account numbers, as defined in Company information. |
|
Example |
Press <F5> for All inventory accounts. |
5. Product category
The report can be restricted to items in a particular category.
Options
Enter the category to print the report for only one product category or use one of the following options:
|
<F5> |
To include All items regardless of whether they have a category. |
|
<Enter> |
To include only those items which do not have a category |
|
Format |
Up to five characters |
|
Example |
Press <F5> for all categories |
6. Product sub-category
If you entered Blank in the previous field, this field also displays as Blank and may not be changed.
The report can be restricted to items in a particular sub-category.
Options
Enter a product sub-category, or use one of the options:
|
<F5> |
To include All items regardless of whether they have a sub-category. |
|
<Enter> |
To include only those items which do not have a sub-category |
|
Format |
Up to five characters |
|
Example |
Press <F5> for all sub-categories |
7. Print 2nd line of desc?
Answer Y to print the second line of description. If you answer N, the second line of description is not printed.
|
Format |
One letter, either Y or N. The default is N. |
|
Example |
Press <Enter> to accept the default. |
8. Suppress blank lines ?
Answer Y to eliminate blank lines between items on the report. Answer N if you wish to skip one line prior to printing each item.
|
Format |
One letter, either Y or N. The default is Y. |
|
Example |
Press <Enter> to accept the default. |
9. Include items which have no YTD activity?
Answer Y to include items with Qty YTD and Sales YTD of zero. Answer N to exclude inactive items.
|
Format |
One letter, either Y or N. The default is N. |
|
Example |
Press <Enter> to accept the default. |
10. Print items which have no QTY on hand ?
Answer Y to include items which have no Qty on-hand. Answer N to exclude inactive items.
|
Format |
One letter, either Y or N. The default is Y. |
|
Example |
Press <Enter> to accept the default. |
Make any changes at Field number to change ?, and then press <Enter> to continue.
Definition of the boundaries between the codes occur upon a separate screen.
The following screen displays:
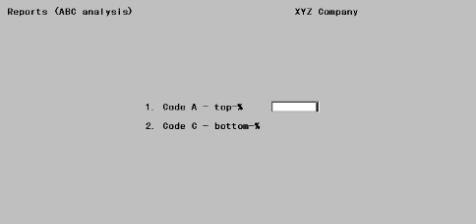
Enter the information as follows:
Code A - top %
Enter the percentage of sales, cost, or margin that will define the top (A) percentage.
|
Format |
99.99 |
|
Example |
Type: 80 |
Code C - bottom %
Enter the percentage of sales, cost, or margin that will define the bottom (C) percentage.
|
Format |
99.99 |
|
Example |
Type: 5 |
In the example above, Code A will include those items whose combined sales volumes (by dollar) made up the top 80% of sales. Code C will include those items whose sales volumes made up the bottom 5% of sales. Code B will include all other items.
Resetting the ABC codes
After the report is printed, you are asked if you wish to reset the ABC codes for these items to their new values.
If you answer Y, the ABC code for each item printed is set to its A, B, or C value. Although these codes are not used to create this report (which generates them each time), they do have informational value as they appear on various screens and reports. It is advantageous to keep them reasonably up to date.